Immigration is often at the center of heated debates, but amidst the controversy lies an undeniable truth: immigration is a powerful engine for innovation and economic growth in the United …
The Importance of Self-Advocacy: Deb Dutta’s Journey from Product to Founder
In this episode, Sophie speaks with Deb Dutta, the founder of Criya, who shares her journey from corporate product management to entrepreneurship and offers valuable insights for aspiring founders, …
Authentic Connections: Lior Klisman’s Journey to Building Borderless
Sophie recently spoke with entrepreneur Lior Klisman, who opened up about his journey from founding a startup to his current venture, Borderless, dedicated to supporting immigrant founders in the US. …
Continue Reading about Authentic Connections: Lior Klisman’s Journey to Building Borderless →
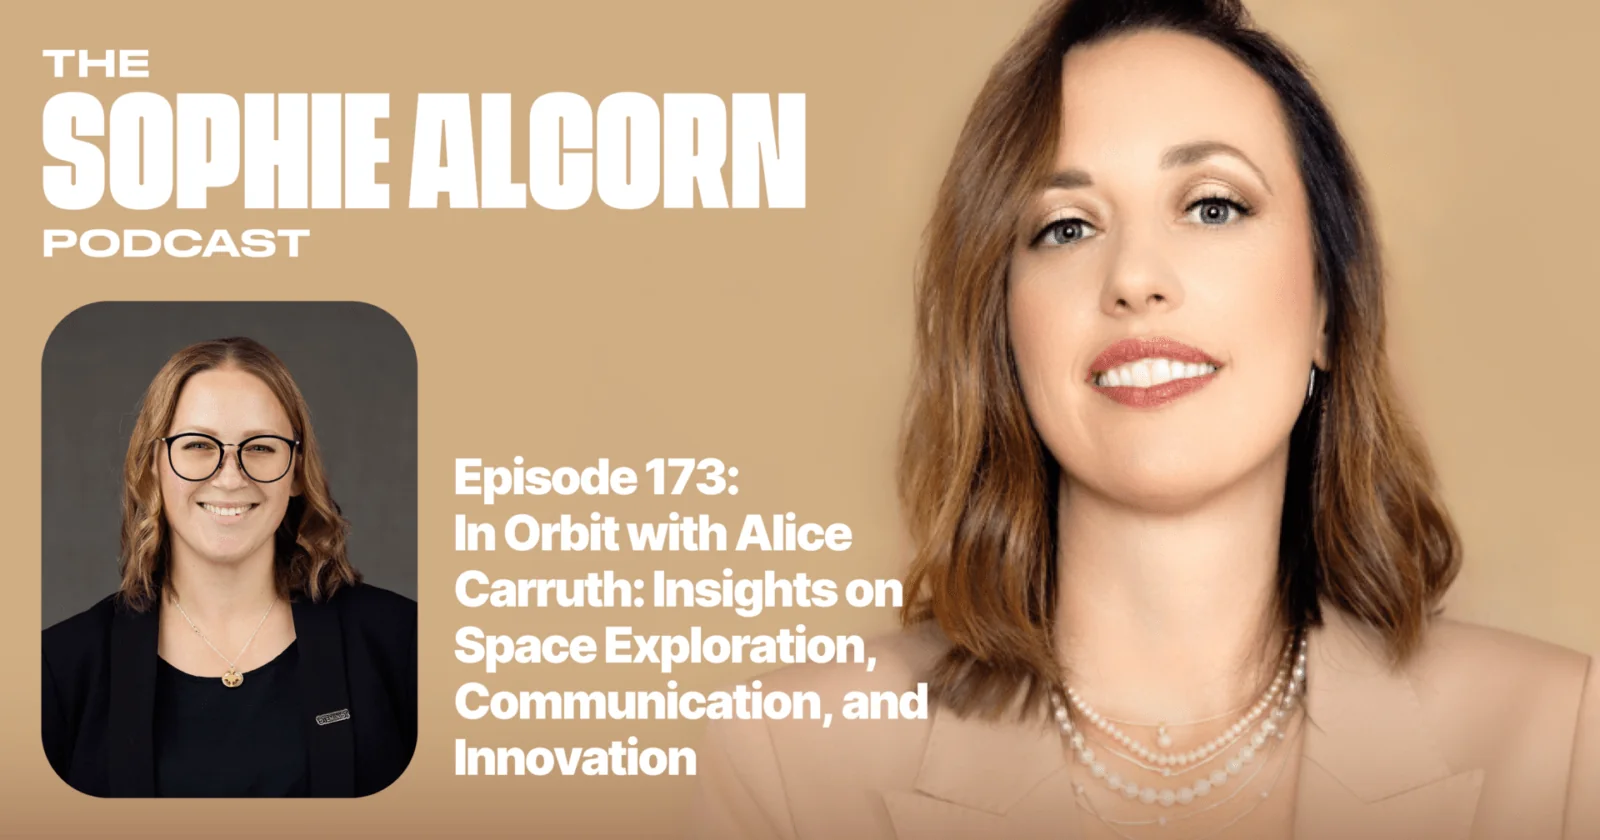
In Orbit with Alice Carruth: Insights on Space Exploration, Communication, and Innovation
Listen to Sophie’s conversation with Alice Carruth, a passionate advocate for space exploration and communications. Alice shared her remarkable journey from being a television producer in the UK to …
Turning Adversity into Opportunity: Faris Alami’s Path from Refugee to Entrepreneur
Faris Alami's story is one of resilience and determination, tracing his path from a Palestinian refugee in Kuwait to a successful entrepreneur in America. Despite facing numerous challenges and …
Space Governance and Human Coexistence: Challenges and Opportunities for Peace
This episode explores themes ranging from space governance to fostering peace and embracing feminine leadership qualities. The vision behind these endeavors is rooted in achieving a world beyond war, …
Strategic Expansion for Founders: Lessons from Serial Entrepreneur David Rose
In the fast-paced world of startups, success isn't just about having a great idea—it's about knowing when and how to bring it to market, building meaningful relationships, understanding your target …
Alcorn Immigration Law Leverages International Entrepreneur Rule to Support Startup Founders Pursuing U.S. Residence
Silicon Valley’s premier immigration law firm announces representation for entrepreneurs seeking to establish roots in the U.S. through the International Entrepreneur Rule. FOR IMMEDIATE RELEASE. …
Mastering the H-1B Visa Process: Insider Strategies for a Successful Petition
Navigating the complex world of H-1B visas can be daunting for tech professionals, startup founders, and HR experts. But with the right insider strategies, you can transform your H-1B lottery …
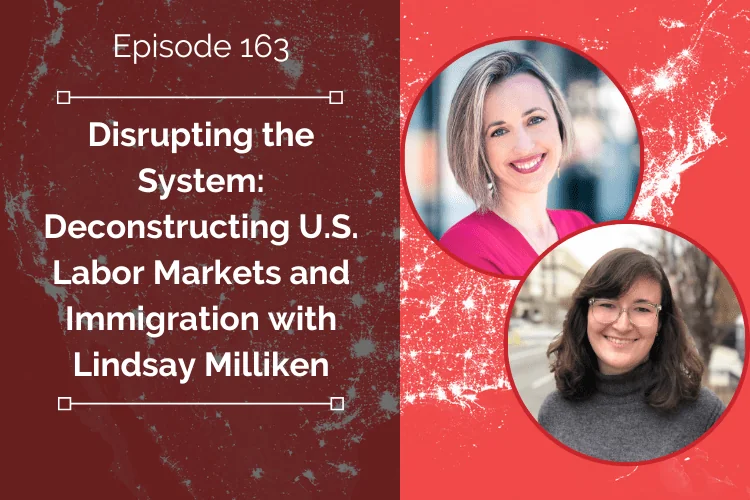
Disrupting the System: Deconstructing U.S. Labor Markets and Immigration with Lindsay Milliken
The landscape of technology and innovation in the United States is at a pivotal crossroads. The key to unlocking the next wave of breakthroughs and advancements could very well lie in the hands of …


